
Performance testing a REST API reveals its runtime behaviour under stress and can be an early indicator of QoS violations in production. Apache JMeter offers a GUI mode where such load tests can be created and their results be analyzed easily.
In this tutorial, I will show you how to test the performance of the FizzBuzz-API written in Rust presented in one of my previous articles. Let’s get started.
Install JMeter
Installing JMeter is very simple once you have Java installed on your machine (there are numerous tutorials to install Java, so I won’t go into detail here).
Once you can run the following command, you can continue with JMeter:
java -version
Download JMeter from this link (select the ZIP archive) and unpack it. In the extracted folder, go to bin/ and execute jmeter.sh (on Linux) or jmeter.bat (on Windows). You should be greeted by the following GUI:
Create a Simple Load Test
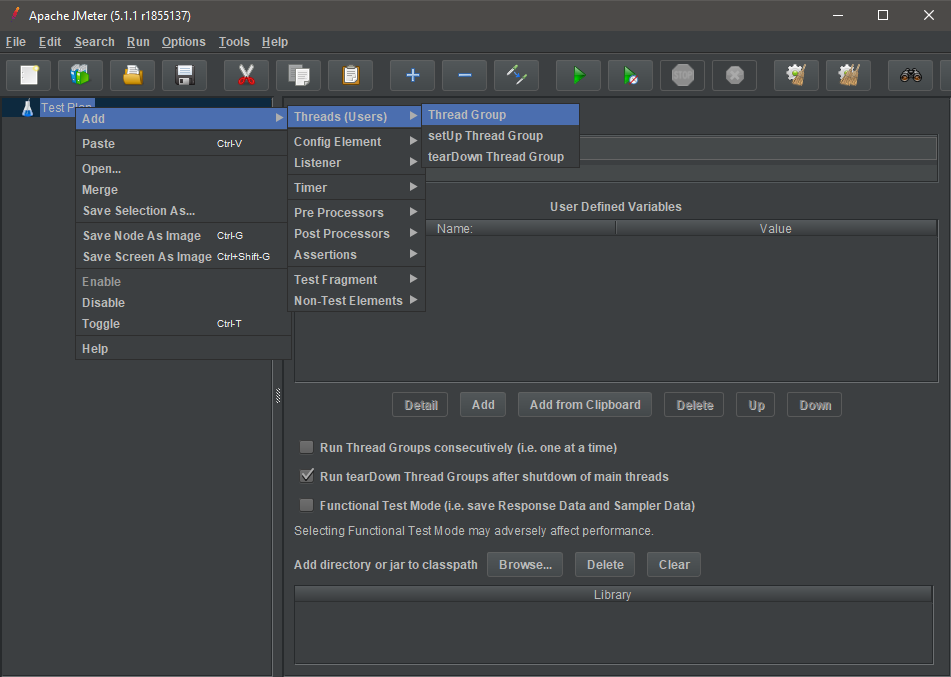
We’ll add a Thread Group which represents a group of artificial users interacting with your API. In the left panel, right click on “Test Plan” and select “Add -> Threads (Users) -> Thread Group”:
Enter the following parameters on the right panel under “Thread Properties”:
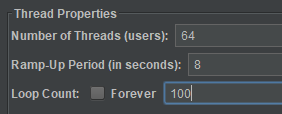
The number of threads determines how many simulated users should connect to your REST API simultaneously. The ramp-up period defines how long JMeter waits before the next request is started.
For example, if we have 64 users and a ramp-up period of 100 seconds, JMeter would add a delay of 100 / 64 seconds between each user’s first request.
Define the Invoked Action
You now have to instruct JMeter on which action should be performed by the simulated users. First, we define the base URL. Right click on the Thread Group and select “Add -> Config Element -> HTTP Request Defaults”.

For my Rust application, I use the following settings:

The default protocol is HTTP and I use localhost:8000 since this is the default port for a Rocket web application.
Next, define which specific endpoint should be used by adding an HTTP Request via “Add -> Sampler -> HTTP Request”:

And enter the following settings:

Notice that protocol and server name / port are left blank because they were set by the HTTP defaults earlier.
In my example, I’m using a GET request on the endpoint /<count> which controls how many FizzBuzz iterations are computed. By changing this number, the computational load per request can be modified. For example, /5000 means that FizzBuzz is computed for the numbers 1 to 5000.
Generating a Response Time Graph
Since we want to monitor how our API performs, the response time graph is an illustrative way of showing the average response time per request. Add it by right clicking the Thread Group and selecting “Add -> Listener -> Response Time Graph”.

The resulting graph will display how long on average it takes for an API call to produce a result.
Run the Test
Although the GUI is not a reliable way to execute tests and the command-line interface should be used instead, you can quickly verify that your test is working correctly by selecting the play button (![]() ).
).
Before starting the test, make sure your API is running and accepting HTTP requests. For Rust and Rocket, you can either run the application with cargo run or compile it and run the resulting binary with cargo build --release and ./target/release/fizzbuzz.exe.
After pressing the play button to start your test, you can track how many connections have been opened on the upper right corner of the interface (14 of 64 users in this example):

While the test is running, the Rust console window is showing a large number of incoming connections when using cargo run:

Interpreting the Response Time Graph
During and after the test, you can have a look at the response time graph by selecting “Response Time Graph” in the panel on the left and “Display graph” in the panel on the right.

In this example, you can easily see that the average response time for 64 parallel users is about 1.3 seconds on my absolutely non-competitive hardware (after the ramp-up period where increasingly more users are added).
Keep in mind that there are many factors contributing to the fact that this number won’t match your real response time in production, including:
- the fact that both JMeter and the API run on the same hardware and have almost no network latency
- the execution of JMeter itself consumes a certain part of the hardware resources
- in a production environment, a web server such as nginx would be used in front of the API
- performance optimizations such as caching would be applied
However, a quick measurement such as this can be more than enough when you just want to verify that you can support a given order of magnitude of parallel requests in production.