
Zabbix is a great open source tool to monitor operating system and application metrics. You can install it on your web server and out of the box, it is able to show you fancy graphs for things like:
- Memory availability
- CPU usage
- Disk space usage
- Network bandwidth
- Free swap space
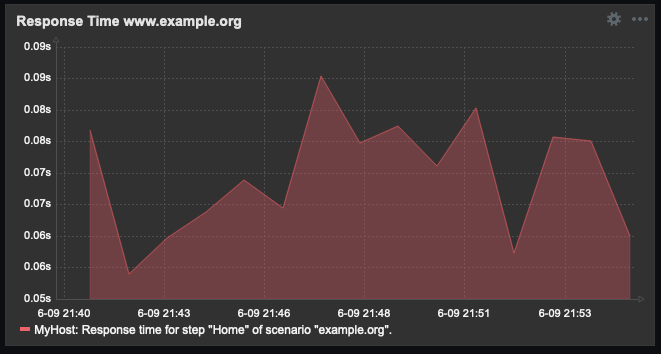
In this guide, I will show you how to create a dashboard widget that displays the response time for a specific URL over time. You can use this to monitor your production website and make sure there are no performance issues. In the end, it will look like this:
Installing Zabbix
There are several detailed guides on how to install Zabbix. I have a CentOS 8 machine, so I used this one: https://computingforgeeks.com/how-to-install-zabbix-server-on-rhel-8-centos-8/.
There are a few important steps to highlight:
If you install Zabbix directly on your web server, you might already have a website running on your hostname. Therefore, to use the Zabbix web frontend, you need to change the automatically generated Apache config file to move Zabbix to a subdomain:
<VirtualHost *:80>
  ServerName zabbix.example.org

  Redirect permanent / https://zabbix.example.org/
</VirtualHost>

<VirtualHost *:443>
  ServerName zabbix.example.org
  Alias /zabbix /usr/share/zabbix

  Protocols h2 http:/1.1

  DocumentRoot /usr/share/zabbix
  ErrorLog /var/log/httpd/zabbix.example.org-error.log
  CustomLog /var/log/httpd/zabbix.example.org-access.log combined

  SSLEngine On
  SSLCertificateFile /path/to/fullchain.pem
  SSLCertificateKeyFile /path/to/privkey.pem

<Directory "/usr/share/zabbix">

# keep everything from the original file after this line

</VirtualHost>
Using this configuration, you can access the frontend as https://zabbix.example.org/ (make sure to set a strong root password and to restrict access to internal IP addresses).
Installing libcurl-devel
It is not listed directly in the documentation, but Zabbix needs the libcurl-devel package to work properly. You can install it with:
yum install libcurl-devel
Without this package, you will not be able to monitor websites.
Configuring Firewall Rules
The original guide linked above suggest to add these firewall rules:
sudo firewall-cmd --add-port={10051,10050}/tcp --permanent
However, if you install Zabbix directly on your web server, you do not need this rule since the Zabbix agent and the Zabbix server are both located on the same host.
If you have already created them, you can remove this rule with:
sudo firewall-cmd --remove-port={10051/tcp,10050/tcp} --permanent
Setting up the Website Monitoring
Once your Zabbix instance is up and running, click on “Configuration” > “Hosts”:
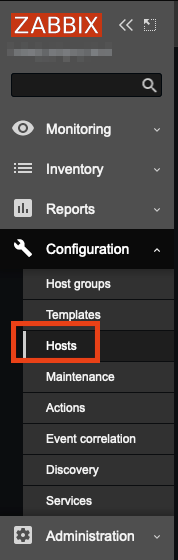
There, find your (only) host and click on “Web”:

Next, click on “Create web scenario”:
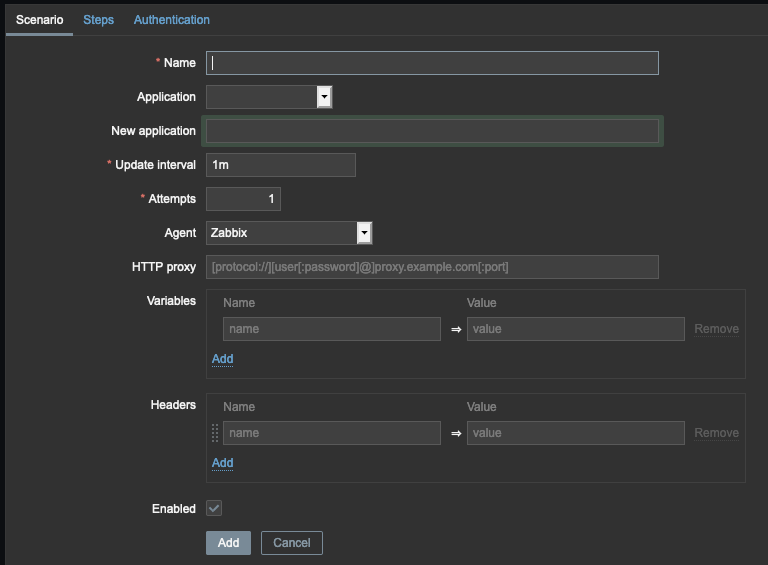
And fill out the first page of the form:
- Name: A description for identifying this scenario later
- Update interval: Defines how often the check should run (I suggest something between 5m and 1h)
Then do not click on “Add” but rather on “Steps” and fill in the second page of the form:
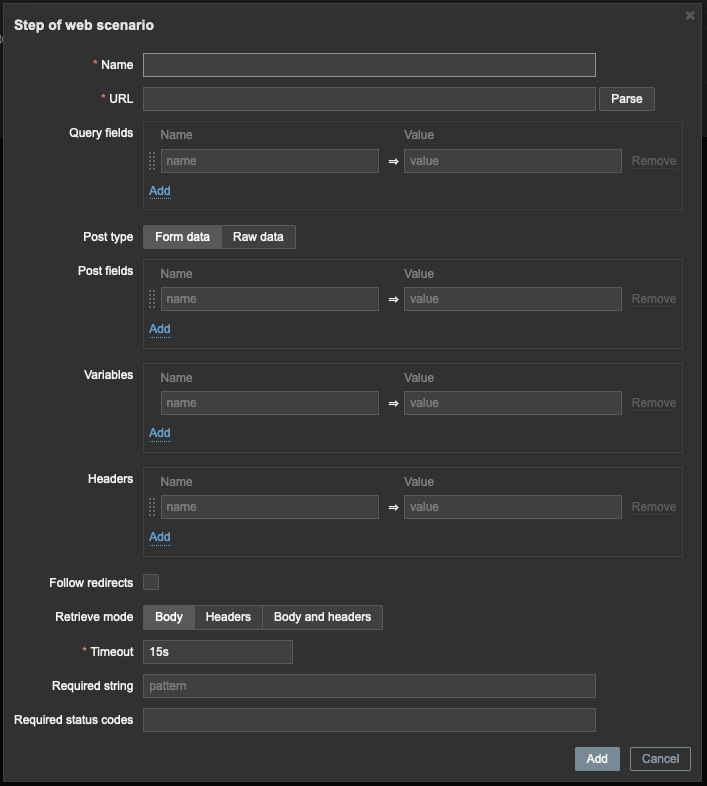
- Name: Descriptive name for the step, such as “Home”
- URL: The actual URL you want to monitor
- Timeout: If no response is generated, the request will be aborted after this time interval
- Required string: Pick a small text that should occur in the generated HTML if everything works. This could be something simple such as your company name
Click on “Add” and save the scenario.
Display a Fancy Graph in the Dashboard
This is the main reason why we are here: we want to see a beautiful graph depicting our landing page response time over time.
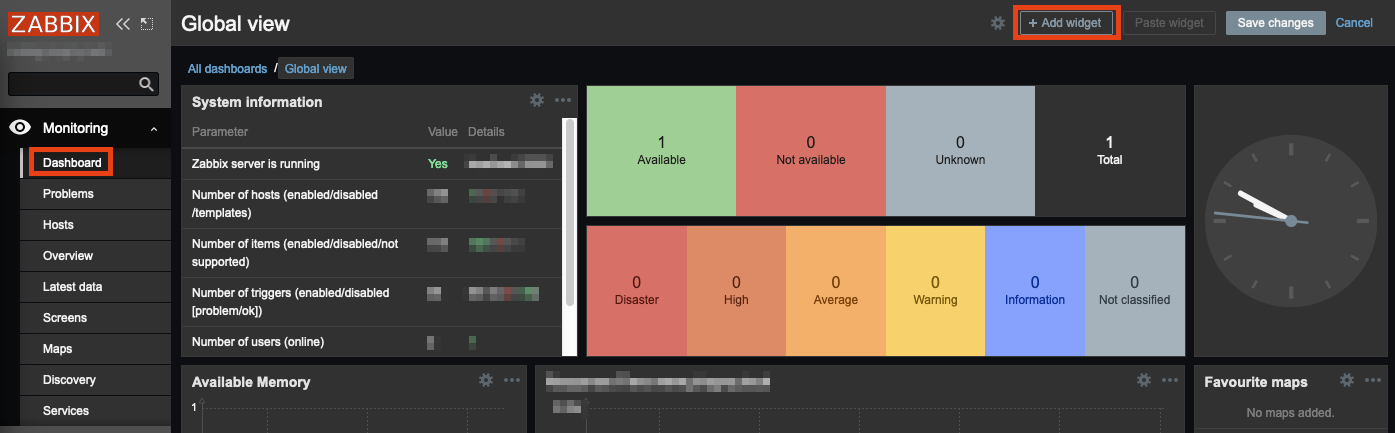
Navigate to “Monitoring” > “Dashboard” and click “Edit dashboard” and “Add widget”:
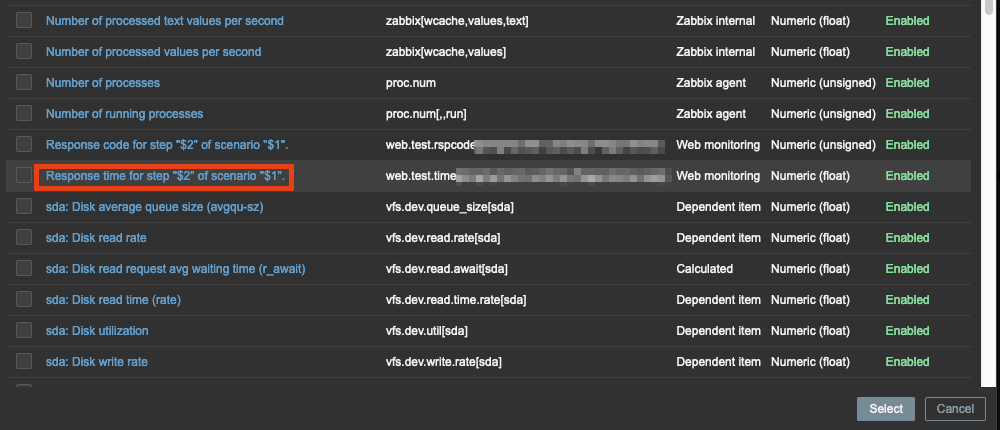
Next to “Type”, select “Graph”. On the bottom next to “Data set”, select your host as host pattern and “Response time for step “$2” of scenario “$1″” as item pattern:
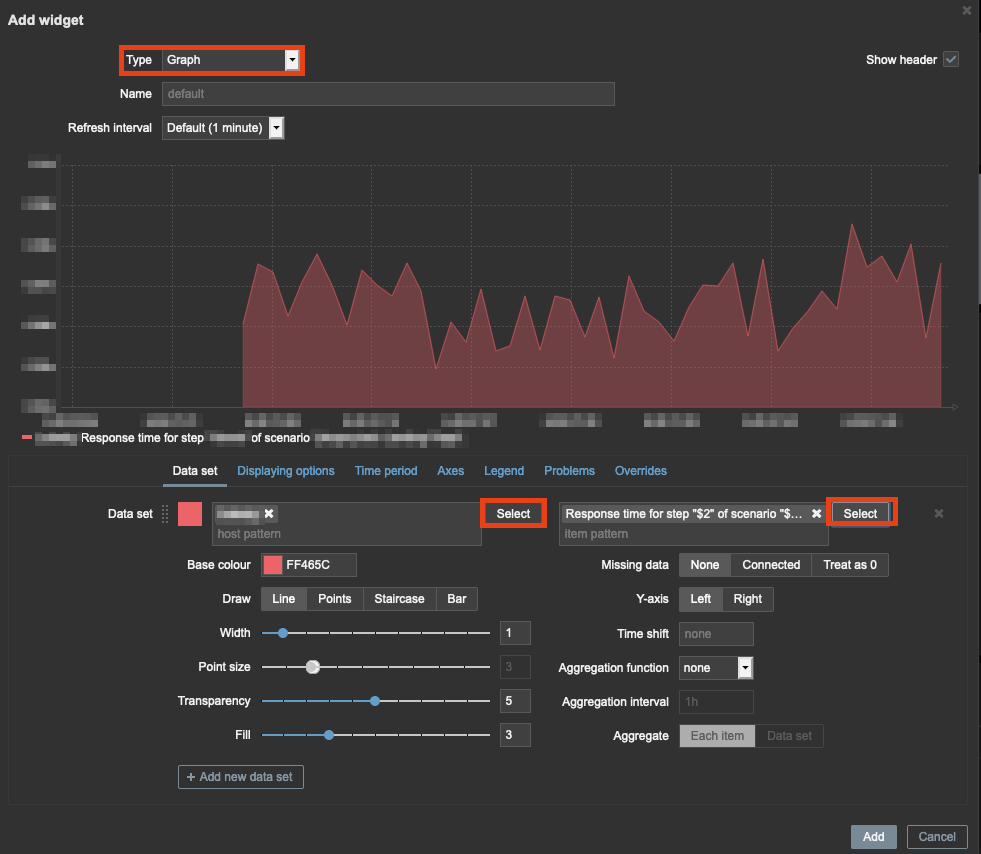
Click “Add” to finish the widget setup and drag the new widget to the position on the dashboard you like best.
Congratulations!
You have successfully set up a response time widget for your website. You can set up more complex scenarios using multiple steps, configure notifications and much more using Zabbix. Let me know if this was helpful and tell me more about your Zabbix use cases in the comments below!